Overview
The ParagonVoIP Contact Center solution provides the monitoring tools and reporting capabilities needed to manage a typical contact center operation. The locus of this capability is found in the PBX portal when logged-in using the Call Center Supervisor role. The Call Center Supervisor Home page displays statistics and reports related to the call queues that a supervisor manages. When configured the Stats Grid will display custom statistics for your call center which are color coded on a scale of red to green based on lower and upper thresholds of certain call center aspects that you can configure.
Definitions
Call Center Supervisor Scope - An access level of the PBX Portal that is normally assigned to a Call Center Supervisor.
Home Page/Dashboard - The screen displayed when you first log into the PBX Portal with call center supervisor scope. This is also accessible to users of higher scope than call center supervisors.
Stats Grid - The custom statistics displayed in the top right corner of the Home page that can be configured with an lower and upper threshold.
Lower Threshold - The value set for a call center aspect such that when the lower threshold is reached, the corresponding square in the stats grid will turn yellow. This value should be lower than the Upper Threshold except in the case of the service level agreement threshold. If this is left blank then the color will turn yellow at 70% of the upper threshold.
Upper Threshold - The value set for a call center aspect such that when the upper threshold is reached, the corresponding statistic square will turn red. This value should be higher than the lower threshold except in the case of the service level agreement threshold.
Service Level Agreement - This determines if a call was answered in an acceptable amount of time (in seconds). This is used in calculating the Service Level Percentage statistic.
Rules
Call queues can be configured and modified only by users with a scope of Office Manager/Call Center Supervisor or higher.
Only once a call queue is set up can agents be added.
Call queues can contain both on-net and off-net agents.
Call queues need to have a numerical “name.”
Only online agents can be part of an active queue.
If an agent's device is not registered then the agent will be considered to be offline.
Icon colors represent agent status; grey - offline, green - online, red - online but currently taking a call.
Agents that are a part of multiple queues can prioritize one queue over another.
Agents are able to indicate the reasons for their availability/unavailability - Logged In, Lunch, Break, Meeting, Web and Other
Home Screen
The following is the home screen for the Call Center Supervisor. From this screen you can access all of the contact center features.

The most prominent aspect of the Call Center Supervisor Home page is the Stats Grid. This grid provides a summary of the most important metrics in a simple and concise format.

| Abbreviation |
Meaning |
|---|---|
| CW |
Calls Waiting |
| AWT |
Avg Wait Time |
| AHT |
Avg Hold Time |
| ABN |
Abandon Rate |
| CA |
Calls Answered |
| CV |
Call Volume |
To edit the Stats Grid, click on the Settings button located right above the Stats Grid panel.

The panel below will pop open into a modal box with two tabs. From the first tab, labelled Stats Grid, you can configure Lower and Upper Thresholds for the statistics that you wish to be displayed in the Stats Grid.

Under the General tab you can configure the Service Level Agreement.

This Service Level Agreement allows you to track whether a call was answered in an acceptable amount of time (secs). This is used in calculating the Service Level Percentage statistic.
Lastly, the Filter Stats Grid by Queue drop down bar allows users to only shows the Stats Grid for one specific call queue.
Call Center Reports
The portal is able to generate custom reports about call queues. These reports will give an graphical overview of certain statistics of your contact center over a given period of time. These reports can be about the contact center as a whole, queues, or individual agents.
To begin looking at the call center reports, click on the Reports tab from the call center home screen.

Select a date range and type of report that you wish to generate. The options available and explained below are: Queue Stats, Agent, Stats, Agent Availability, DNIS (Dialed Number) and Abandoned.
Queue Statistics
The queue statistics allows supervisors to view specific attributes on a queue-by-queue basis. The attributes are all configurable within the pop up.

Each queue has a variety of different parameters that you can view, including volume, calls handled, average talk time, average wait time, abandoned calls and many more. These can be selected from the dropdown on the left side of the popup. Table A, below details each metric.

To select the different settings available to graph for the queue, select the Table Settings gear from the pop up. This will bring up a list of check boxes that will change what fields are in the drop down shown below.

You can now select the specific statistics that you wish to show on your report. The available options are shown in Table A below.
You can click the checkboxes in the first column for Call Queue statistics to graph them individually, as shown in the above screenshot with the different colored rows.
TABLE A - Stats Available by Queue
| Volume (VOL) |
Total number of calls per queue, including calls that never made it all the way through the Auto Attendant. |
| Call Handled (CH) |
Total number of calls per queue that were answered. |
| Calls Offered (CO) |
Total number of calls the entered the queue. |
| Adjusted Calls Offered (ACO) |
(Calls Offered) / (Calls abandoned in <10 seconds) |
| To Vmail |
Total number of calls handled by the automated voicemail system. |
| Forwarded |
Total number of calls forwarded to another queue or offnet phone number for handling. |
| Avg Talk Time (ATT) |
The Average Time agent spent talking to customers (not including hold time). |
| Avg After Call Work (ACW) |
The average time between te end of the call and when the agent submits the disposition. |
| Avg Hold Time (AHT) |
Average time that a customer was on hold (Doesn’t include time in the queue). |
| Service Level (SL) |
Percentage of calls answered from the queue wiithin 60 seconds. Other time windows available. |
| Dial Transfers (DT) |
Percentage of calls that landed in the queue and were eventually transferred out to an agent. |
| Abandoned Calls (AC) |
The number of calls that hung up while in queue (before being transferred out to an agent). |
| Adjusted Abandoned Calls (AAC) |
The number of calls abandoned in under 10 seconds. |
| Abandon Rate (AR) |
The ratio of (Abandoned Calls)/(Calls Offered) |
| Adjusted Abandoned Rate (AAR) |
The ratio of (Adjusted Abandoned Calls)/(Adjusted Calls Offered) |
| Avg Handle Time (AHT) |
Mathematical Average of: Talk Time + Hold Time + Disposition Time |
| Avg Answer Speed (AAS) |
Average time in the queue for calls that were eventually dispatched to an agent. |
Agent Statistics
The agent statistics page will display a variety of agent aspects compared with other agents over time. This graphical representation of agent statistics is displayed below.

You can click the checkboxes in the 1st column for Agent statistics to graph them individually; as shown in the above screenshot with the different colored rows. Also, clicking on the 1st column header 
Agent Availability
The portal can generate a graphic report of the availability of agents in the domain or in a department within a domain. The values that are to be graphed are chosen from the options shown below:

When configured and when agents have been signing in and out, supervisors can see an agent availability display similar to the following.

TABLE B - Stats Available by Agent
| Call Handled (CH) |
Total number of calls per queue that were answered. |
| Avg Talk Time (ATT) |
The Average Time agent spent talking to customers (not including hold time). |
| Avg After Call Work (ACW) |
The average time between te end of the call and when the agent submits the disposition. |
| Avg Handle Time (AHT) |
Mathematical Average of: Talk Time + Hold Time + Disposition Time |
| Logged In Hours (LI) |
Number fo hours the Agent logged-in over the time span. |
| Talking Timr (TT) |
Number of total minutes spent on calls. |
| Available (AM) |
Number of total minutes spent in the Available state. |
| Unavailable (UM) |
Number of total minutes spent in the Unvailable state. |
| Lunch (L) |
Number of total minutes spent in the Lunch state. |
| Break (B) |
Number of total minutes spent in the Break state. |
| Meeting (M) |
Number of total minutes spent in the Meeting state. |
| Web (W) |
Number of total minutes spent in the Web state. |
| Other (O) |
Number of total minutes spent in the Other state. |
| Outbound Attempt (OATT) |
Number of outbound calls attempted by Agent in the given time period. |
| Outbound Answered |
Number of outbound calls by Agent that were Answered in the given time window. |
| Outbound Minutes (OM) |
Total Minutes on outbound calls made by Agent in given time window. |
| Outbound Average (Oavg) |
Average time per call on outbound calls made by Agent in given time window. |
| Inbound Answered (IANS) |
Number of total inbound calls answered by Agent in given window from HG and direct. |
| Inbound Minutes (IM) |
Total Minutes on inbound calls answered Agent in given window from HG and direct. |
| Inbound Avg (IAVG) |
Average time per call on inbound calls made by Agent in given window from HG and direct. |
DNIS Statistics
The system can generate graphs based on the Dialed Number Identification Service (DNIS). DNIS is a telephone service that identifies for the receiver of a call the number that the caller dialed. It is a common feature of 800 and 900 lines. If you have multiple 800 or 900 numbers to the same destination, DNIS tells you which number was called.
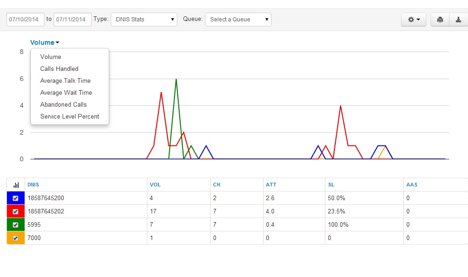
You can click the checkboxes in the 1st column for DNIS statistics to graph them individually; as shown in the above screenshot with the different colored rows. Also, clicking on the 1st column header 
TABLE C - Stats Available by DNIS (dialed number)
| Volume (VOL) |
Total number of calls per queue, including calls that never made it all the way through the Auto Attendant. |
| Call Handled (CH) |
Total number of calls per queue that were answered. |
| Calls Offered (CO) |
Total number of calls the entered the queue. |
| Adjusted Calls Offered (ACO) |
(Calls Offered) / (Calls abandoned in <10 seconds) |
| To Vmail |
Total number of calls handled by the automated voicemail system. |
| Forwarded |
Total number of calls forwarded to another queue or offnet phone number for handling. |
| Avg Talk Time (ATT) |
The Average Time agent spent talking to customers (not including hold time). |
| Avg After Call Work (ACW) |
The average time between te end of the call and when the agent submits the disposition. |
| Avg Hold Time (AHT) |
Average time that a customer was on hold (Doesn’t include time in the queue). |
| Service Level (SL) |
Percentage of calls answered from the queue wiithin 60 seconds. Other time windows available. |
| Dial Transfers (DT) |
Percentage of calls that landed in the queue and were eventually transferred out to an agent. |
| Abandoned Calls (AC) |
The number of calls that hung up while in queue (before being transferred out to an agent). |
| Adjusted Abandoned Calls (AAC) |
The number of calls abandoned in under 10 seconds. |
| Abandon Rate (AR) |
The ratio of (Abandoned Calls)/(Calls Offered) |
| Adjusted Abandoned Rate (AAR) |
The ratio of (Adjusted Abandoned Calls)/(Adjusted Calls Offered) |
| Avg Handle Time (AHT) |
Mathematical Average of: Talk Time + Hold Time + Disposition Time |
| Avg Answer Speed (AAS) |
Average time in the queue for calls that were eventually dispatched to an agent. |
| Available Minutes (AM) |
Number of total minutes spent in the Available state by all Agents in all Queues. |
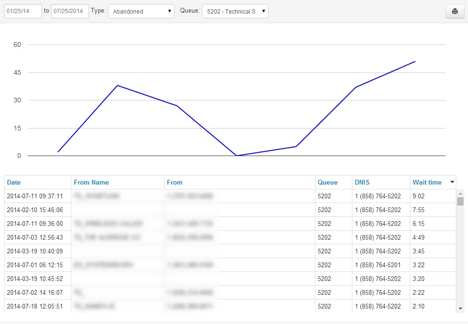
Abandoned Calls
The system can generate call center graphs for abandoned calls broken up by individual queues. This is displayed with time in the x axis and the number of calls abandoned in the y axis. All of the abandoned calls for the queue are displayed below the graph, including some statistics of each individual call.